The average American consumes around eighty gallons of water per day—or 668 pounds—according to the U.S. Geological Survey. With our current population, that equates to approximately 248.6 billion pounds of water used in the U.S. every day! It can be mind-boggling to understand how all this water gets to people’s homes, so here is an explanation of how that happens.
Water Sources
Your water source depends on where you live. For example, many New Yorkers get their water from the Delaware River. Chicagoans rely mostly on Lake Michigan, while a farmer in Nebraska might have a private water well pumping from an aquifer. In California, some people get water from melted snow high up in the Rocky Mountains. At the most basic level, water comes from either a groundwater source or a municipal freshwater source.
Where Does Well Water Come From?
A well system taps into a groundwater source below bedrock. If you have a private well, then you are solely responsible for the digging, pumping, and filtration of your water and all the associated risks. Depending on how far below the surface the groundwater source is, digging a water well might involve hiring someone to come out with a rotary drilling machine. Shallower water wells come with increased risks of contamination since dirtier surface water can seep into the source. Deep water wells are typically less contaminated. Once the well is dug, you must install a pump and hire a water testing company to come out and regularly test your water for contaminants. You can also buy home water test kits although these are far less thorough in their analysis. Public groundwater wells operate under the same principles but are owned and operated by a public body, so you do not have to do all the hard work yourself.
Where Does City Water Come From?
Municipal, or city water, is drawn from a large freshwater source, such as a lake or river and serves many people across a wide geographic area. It is a public utility that you pay for through taxes and water bills. First, the utility moves water from the freshwater source to a treatment center. Ideally, this is done through gravity (i.e. the treatment center will be at a lower elevation than the freshwater source so the water can flow down through aqueducts and pipes). Gravity flow has been used since ancient times, and 2,000-year-old Roman aqueducts can be visited to this day. As water flows into the treatment plant, it is fed through various stages of purification to remove harmful contaminants from the water and improve the taste and odor. These stages typically include separating scum from the water, adding chlorine to disinfect the water and using ultraviolet light to kill viruses. Once the water is purified, it flows out to local pumping stations and water towers. Then, it is pumped to your neighborhood and enters your home through the main water line. While the utility handles all water pipe maintenance outside your property, you are responsible for maintaining your main water line and home piping.
Municipal Water Reports
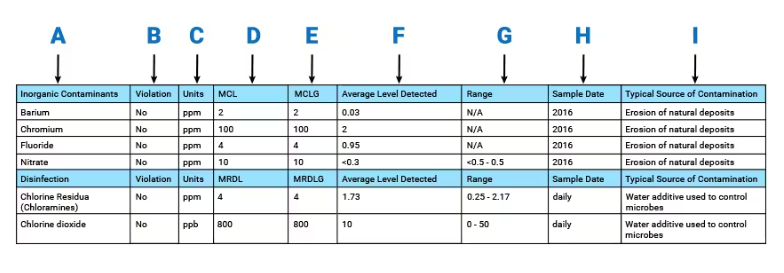
If you get municipal water, you can get an idea of your water quality by reading the annual water quality report, also known as a “Consumer Confidence Report.” By law, your local water supplier is required to publish a report every year that lists where your water comes from, the levels of various contaminants in the water, and how they compare to permitted levels. These water reports are typically available on your city’s website. Check out the following example of a municipal drinking water report and the related terms:

- Contaminant Type – Identifies a specific contaminant in the water
- Violation – Indicates whether a contaminant exceeds allowable levels as determined by the Environmental Protection Agency
- Units – Indicates the unit of measurement (parts per million)
- Maximum Contaminant Level (MCL) – The highest level of a contaminant that is allowed in drinking water. MCLs are set as close to the MCLGs as feasible using the best available treatment technology.
- Maximum Contaminant Level Goal (MCLG) – The level of a contaminant in drinking water below which there is no known or expected risk to health
- Average – The average level of a contaminant’s concentration in the water
- Range – The range of a contaminant’s concentration in the water from low to high
- Sample Date – Reports when the water sample was taken
- Typical Source of Contamination – Reports where the contaminant likely came from
In the above example, the maximum contaminant level (MCL) of nitrate allowed in the water is ten parts per million (ppm). In this case, the level goal (MCLG) is also ten, meaning there is no known or expected risk to health below that level. The average level of nitrate detected in the water is less than 0.3 ppm, and the highest levels detected were no more than 0.5 ppm. These levels are far below the maximum level of ten ppm, so there is no violation. The typical source of nitrate in this water report is due to the erosion of natural deposits but is not always the case.
Find Out Your Area’s Water Health
Check out your area’s water contamination levels by visiting EWG’s website here and inputting your zip code.
We can help purify your water with our water treatment systems! Just give us a call today at 803.772.7715 to schedule an appointment with one of our expert plumbers!


